The changing UK economic landscape 2013-2023
The UK economy has experienced significant shocks in recent times but the overall period since UKRN was established is best described as flat on average, with uncertain and tumultuous periods holding the economy back from growth. At the start of the period, the economy was still recovering from the 2008 Global Financial Crisis with austerity in place and uncertainty about the future growth of the economy. The end of the period is overshadowed by the economic shock from the Covid pandemic and inflationary pressures linked to coming out of the pandemic, war in Ukraine and ongoing geopolitical crisis in the Middle East. Uncertainty and turmoil have also affected trade, with Brexit, supply chain problems in Covid and ongoing restrictions linked to global political turmoil.
Economic growth, measured as the % change in GDP quarterly, has been flat over the period, apart from the during the pandemic period. There have been small fluctuations, both upwards and downwards, within the period but the overall picture is of a fairly stagnant economy.
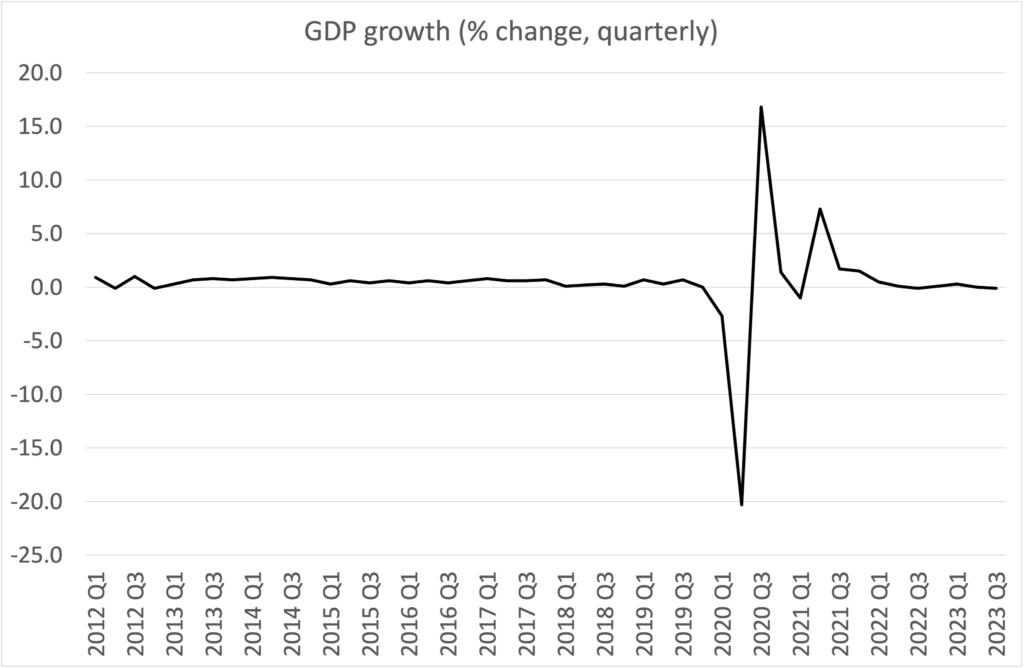
Figure 1: GDP growth (%)
Source: Office of National Statistics (2024), GDP quarterly national accounts time series, Gross Domestic Product: Quarter on Quarter growth: CVM SA %, accessed 14th January 2024, https://www.ons.gov.uk/economy/grossdomesticproductgdp/timeseries/ihyq/qna
Whilst the economy has not grown significantly, or declined significantly over the period there has been a fall in greenhouse gas emissions, although by less than is needed to meet net zero targets. Carbon intensive sectors, particularly energy and transport, and household production have falling emissions levels, helped partially by the restrictions to travel and economic activity during Covid.
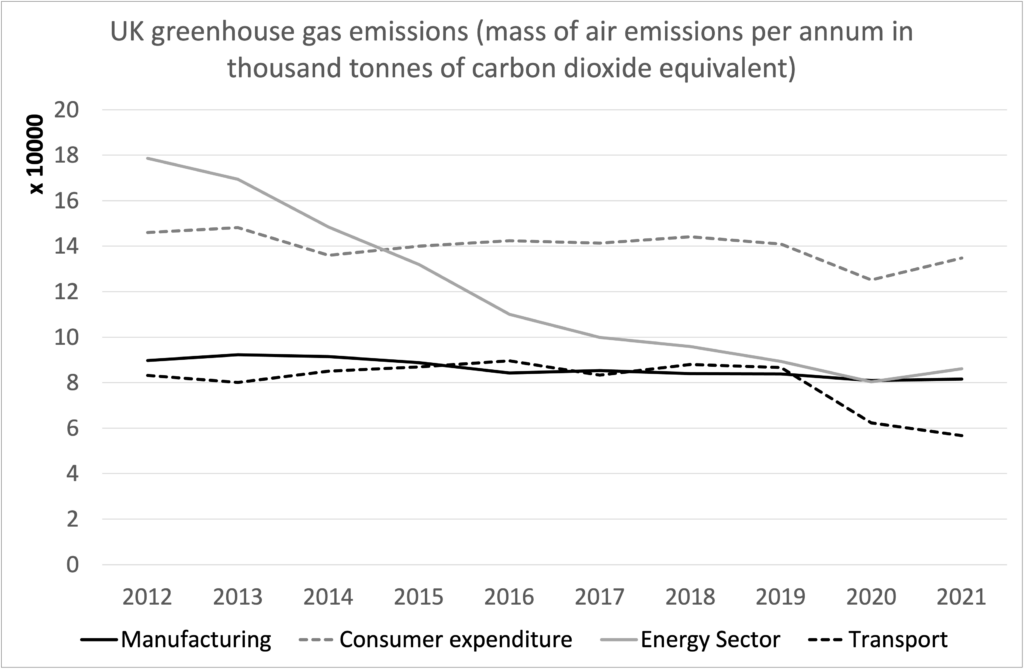
Figure 2: Greenhouse gas emissions
Source: Office of National Statistics (2023), UK Environmental Accounts: 2023, Total UK greenhouse gas (GHG) emissions (residence basis) measured in mass of air emissions per annum in thousand tonnes of carbon dioxide equivalent (CO2e): three highest-emitting industries and households, accessed 14th January 2024, https://www.ons.gov.uk/economy/environmentalaccounts/bulletins/ukenvironmentalaccounts/2023#main-points
Unemployment has fallen since 2012, with a small increase during and after Covid 2020-2021. The labour market is more recently experiencing labour shortages (Statista), at least in some sectors, with businesses struggling to fill vacancies. There has also been little change in labour productivity over the period, with fluctuations in output per worker but only a very small upward trend.
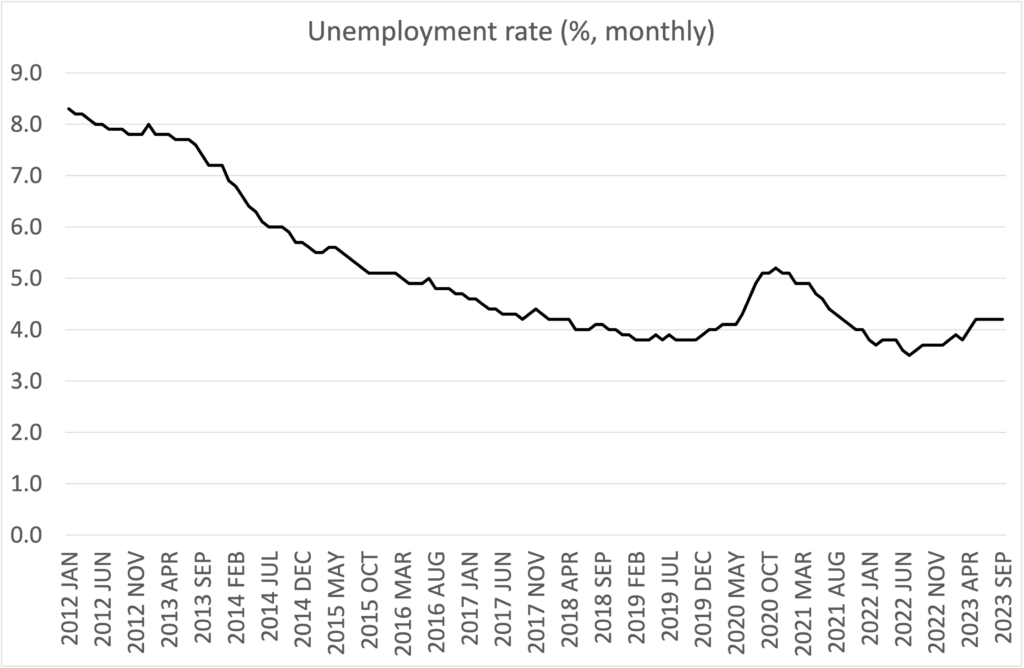
Figure 3: Unemployment
Source: Office of National Statistics (2024), Labour market statistics time series (LMS), LFS Experimental: ILO Unemployment rate: UK: All: Aged 16+ (%): SA, accessed 14th January 2024, https://www.ons.gov.uk/employmentandlabourmarket/peopleinwork/employmentandemployeetypes/timeseries/s2pu/lms
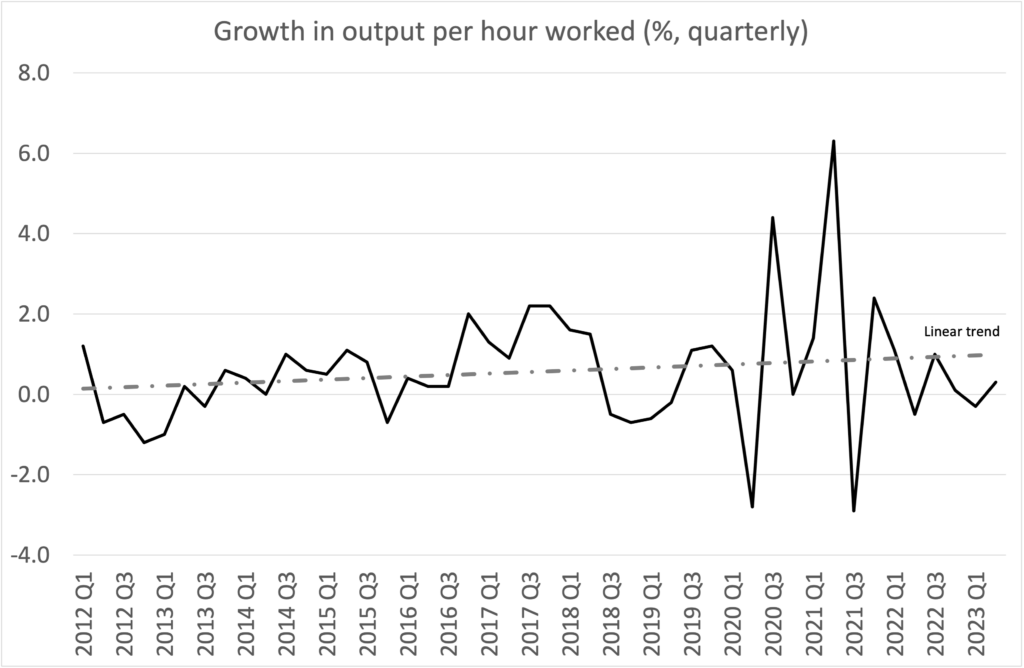
Figure 4: Productivity
Source: Office of National Statistics (2024), Labour productivity time series (PRDY), UK Whole Economy: Output per hour worked % change per annum SA, accessed 14th January 2024, https://www.ons.gov.uk/employmentandlabourmarket/peopleinwork/labourproductivity/timeseries/lzvd/prdy
Inflation was stable, sitting close to the Bank of England target of 2%, up until the end of 2021, but has seen a significant increase since. The rate of growth in prices has declined in 2023 but remains well above the target level and historical trend since the early 1990s. During the period the level of inequality in the UK, measured using different methods, has remained largely the same in aggregate, but this masks regional differences in household income in England and between England, Scotland, Wales and Northern Ireland (ONS).
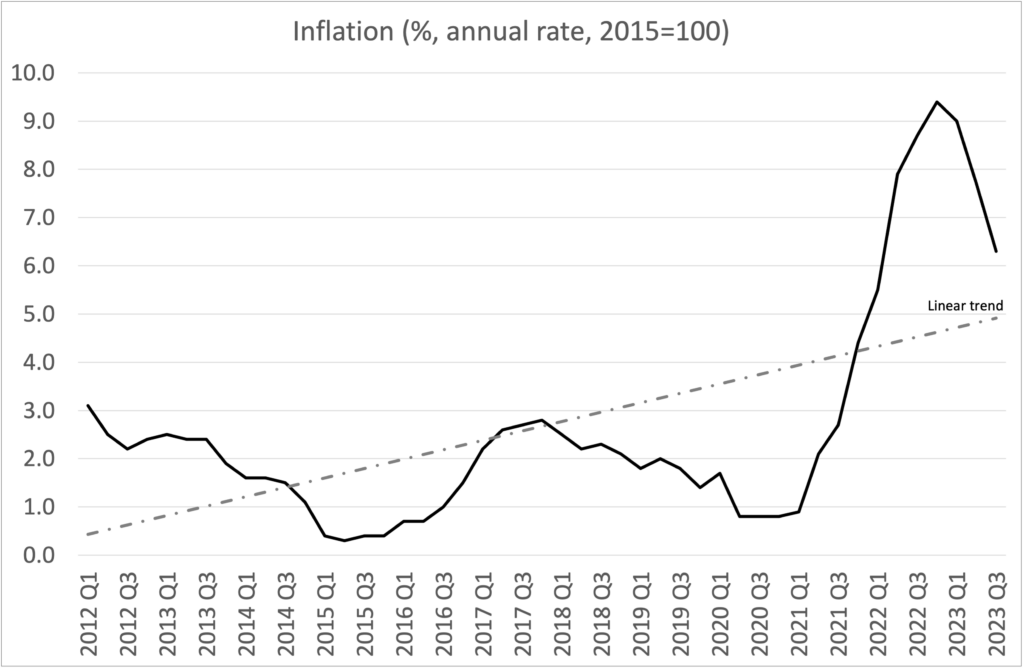
Figure 5: Inflation
Source: Office of National Statistics (2024), Consumer price inflation time series (MM23), UK Whole Economy: CPIH Annual Rate 00: All Items 2015=100, accessed 14th January 2024, https://www.ons.gov.uk/economy/inflationandpriceindices/timeseries/l55o/mm23
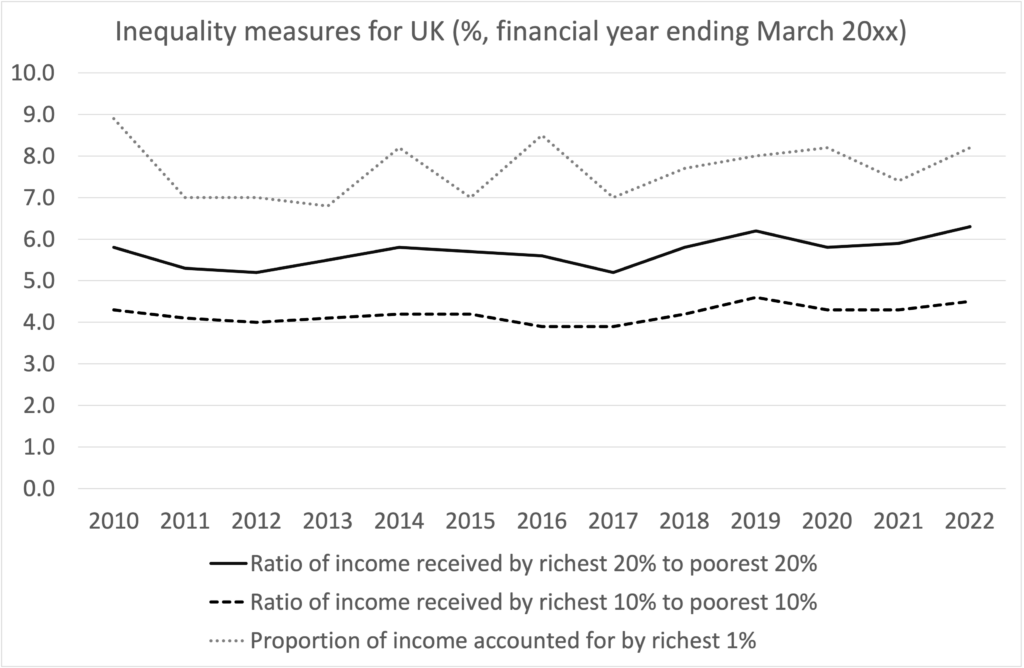
Figure 6:Inequality
Source: Office of National Statistics (2024), Household income inequality, UK: financial year ending 2022, accessed 14th January 2024, https://www.ons.gov.uk/peoplepopulationandcommunity/personalandhouseholdfinances/incomeandwealth/bulletins/householdincomeinequalityfinancial/financialyearending2022#household-income-inequality-data
The cost of debt, using the Bank of England base rate as the proxy measure of what households, businesses and indeed government pay for borrowing, was at a low level for most of the decade. In response to the inflationary crisis, the rate has increased significantly to cool the rate of price rises. The effects of the interest rate changes take times to impact the economy, and whilst it may help with inflation it has a more direct impact on borrowing costs for households and businesses putting further pressure on their household budgets.
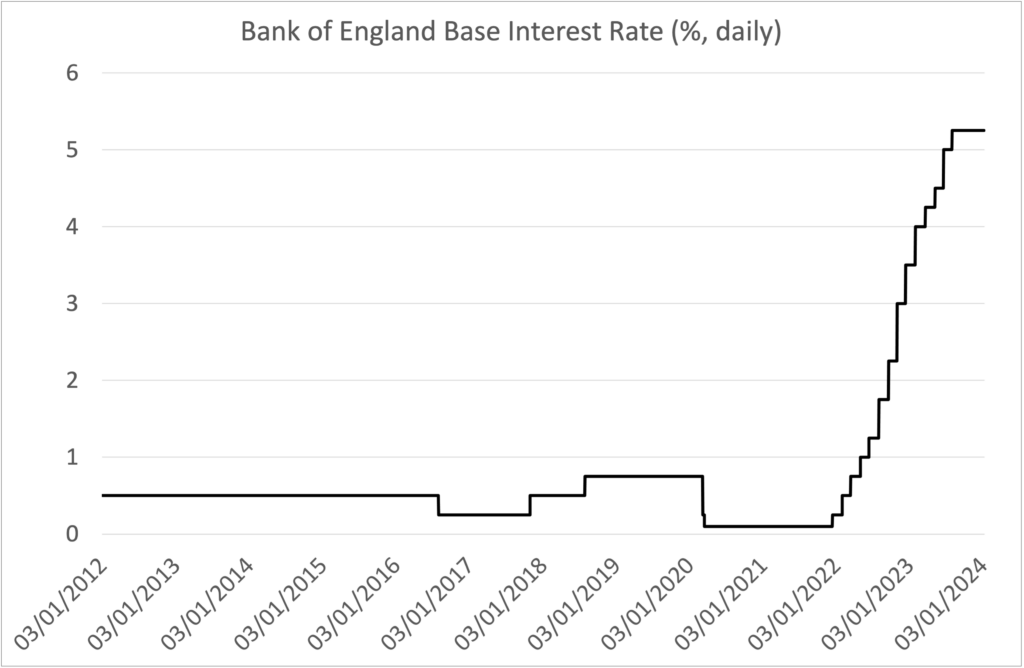
Figure 7:Interest rates
Source: Bank of England (2024), Interest rates and Bank Rate, accessed January 14th 2024, https://www.bankofengland.co.uk/monetary-policy/the-interest-rate-bank-rate
Over the last decade Sterling has fallen in value, with particular declines in 2016 at the time of the Brexit referendum and during Liz Truss’s brief period as Prime Minister in Autumn 2022. The decline in the value of the currency reflects the wider trajectory of the economy, with investors uncertain about the value of sterling in foreign exchange markets. The currency valuation makes imports more expensive for UK businesses and consumers, although it does potentially benefit exporters who get a higher turnover for goods sold (in sterling terms). The exchange rate decline has had less of an impact on trade in goods than might be expected, with imports and exports increasing and decreasing at similar rates. The Covid pandemic, and its associated restrictions on movement of goods, had the most significant impact.
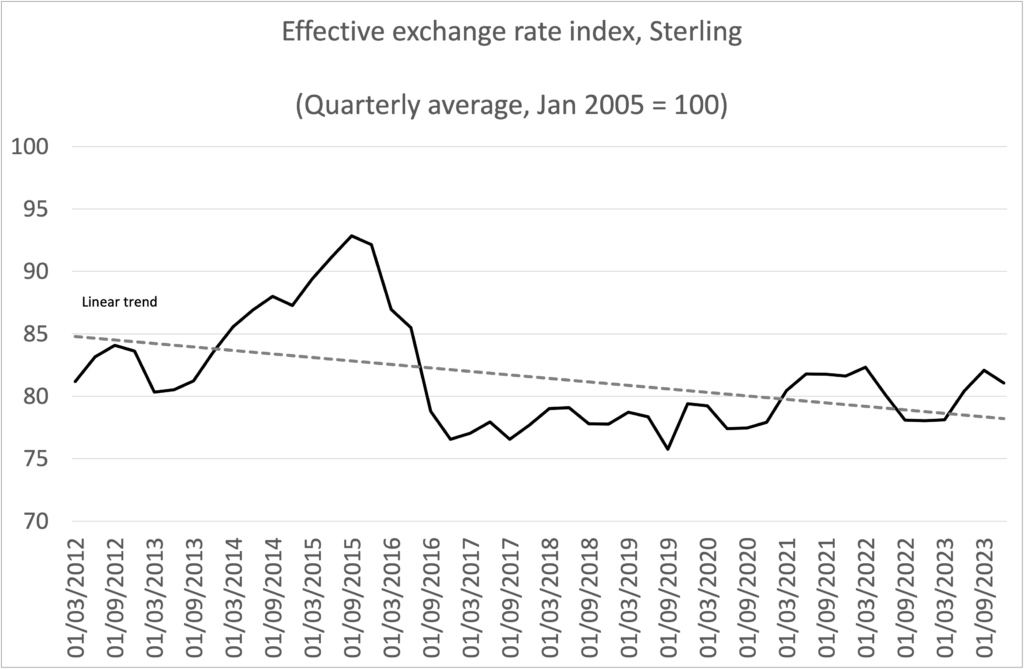
Figure 8: Exchange rate
Source: Bank of England Database (2024), Interest exchange rates etc: Quarterly average Effective exchange rate index, Sterling (Jan 2005=100), accessed January 14th 2024, https://www.bankofengland.co.uk/boeapps/database/default.asp
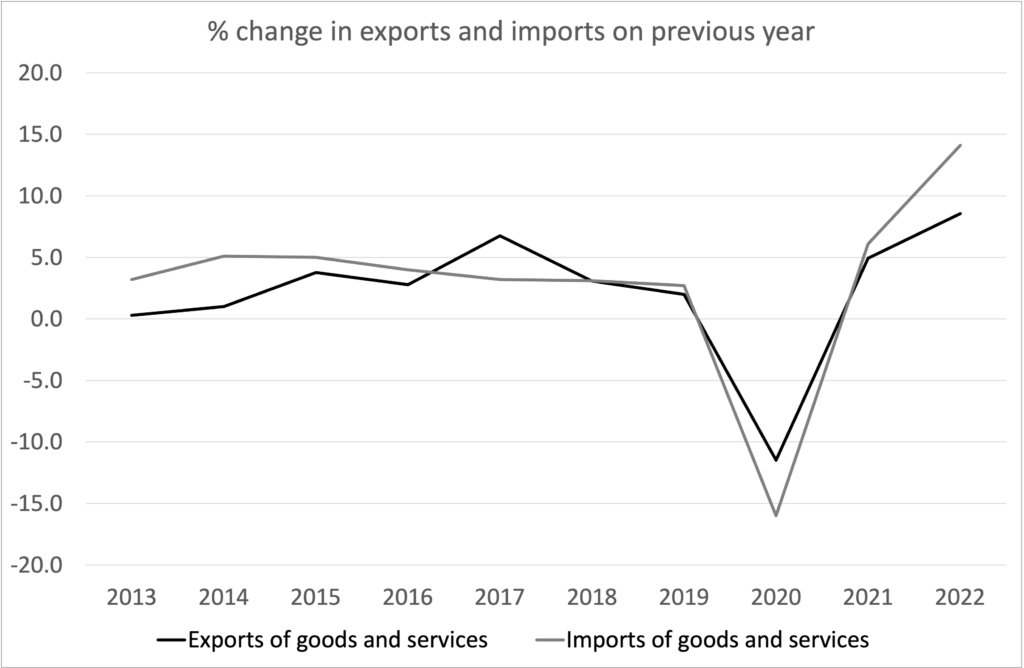
Figure 9: Trade changes
Source: Office of Budget Responsibility (2023) Historical Official Forecasts Database: Exports and imports of goods and services, November, accessed January 14th 2024, https://obr.uk/data/
Businesses, including those regulated by UKRN members, have had much to contend with in terms of buying increasingly expensive inputs for the delivery of their services in global markets, attracting debt and equity financing to a stagnant and uncertain UK economic landscape and managing concerns about the environment and vulnerable consumers in parallel. The customers of the regulated sectors have faced a significant rise in the cost of living and uncertainty about how and when the economy will rebalance to stability. Regulation, and regulators, have adapted to the economic context and continue to evaluate how best to manage ongoing uncertainty in costs and household pressures.